Multi-MPI parameter sweeps
You can find this application in the demos folder of your Jupyter notebook environment.
- athena_read.py
- athinput.blast
- mpi_parameter_sweep.ipynb
- plot_output.py

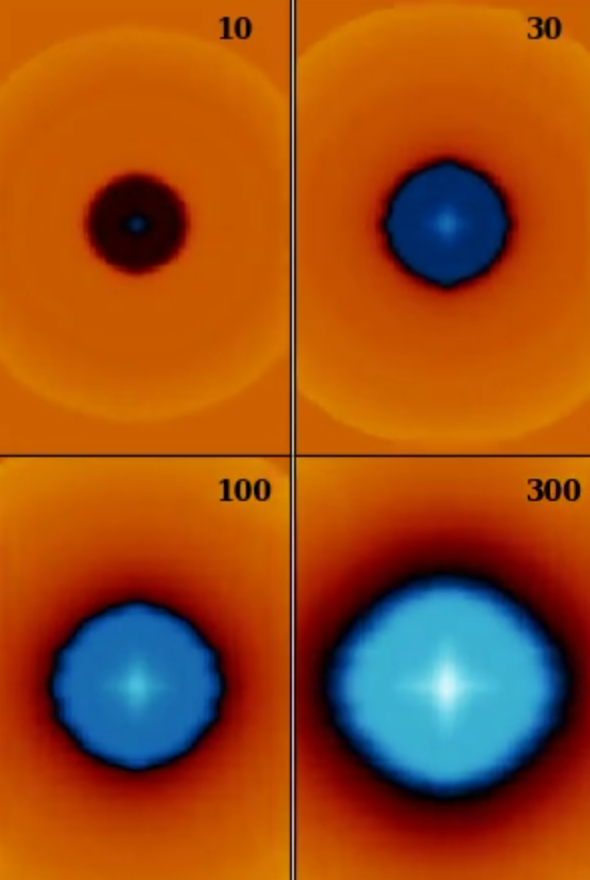
A parallel simulation of four spherical blasts. Scroll down for the video.
In this tutorial, use the create_scatter_job function to run Athena++ code to create parallel MPI simulations of a spherical blast wave.
Compile the executable
First import Camber:
import camberIf needed, clone the Athena repo:
# working directory is where the notebook is located
!git clone https://github.com/PrincetonUniversity/athena.git
Create an MPI job to compile Athena++. This ensures the code is compiled with the correct MPI environment:
compile_job = camber.mpi.create_job(
    command="cd athena && python configure.py --prob=blast -mpi -hdf5 --hdf5_path=${HDF5_HOME} && make clean && make all -j$(nproc)",
    engine_size="SMALL"
)
# check the status of the job
compile_job.statusRun the simulation grid
# The blast problem begins with a central sphere of material with higher pressure than its surroundings.
# The prat parameter sets the ratio.
# In this case, four values ranging from a factor of 10 to a factor of 300.
params = ["10", "30", "100", "300"]
# Run scatter jobs using MEDIUM engines.
# We take advantage of Athena's functionality for over-writing a parameter in the input file frome the
# command line as well as the ability to set the runtime directory
jobs = []
for prat in params:
jobs.append(
camber.mpi.create_job(
engine_size="MEDIUM",
command=f"mpirun -np 16 athena/bin/athena -i athinput.blast problem/prat={prat} -d run{prat}",
)
)# lets check in on how are jobs are doing
jobsOnce the jobs are completed, plot the results:
# Prepare a directory for output images
!mkdir output_images
# import a custom script for reading and plotting the hdf5 outputs, placing images in the output_images directory
# each frame is a 2D slice throught the center of the 3D cartesian grid. This assumes each simulation output
# is in its own runtime directory. We pass the same params dictionary used above for the scatter job.
from plot_output import plot_output
plot_output({"prat": params}, "prat")Visualize results
from IPython.display import Video
Video("density.mov")